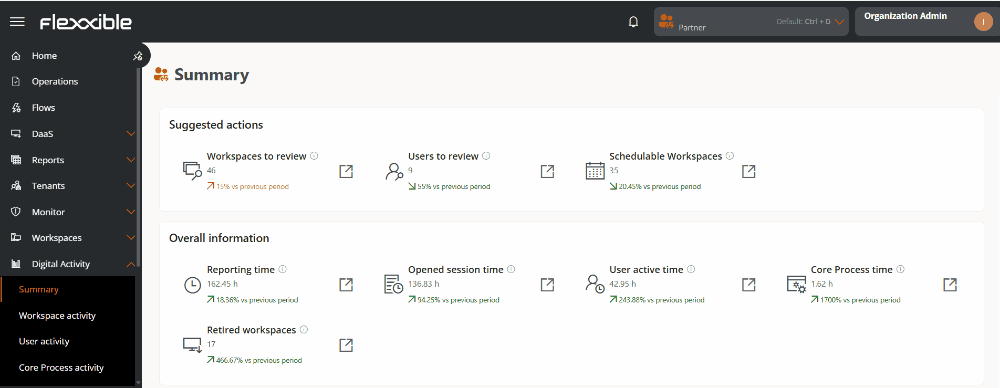
Suggested actions
This dashboard shows automatic recommendations based on detected usage patterns.
Workspaces to review
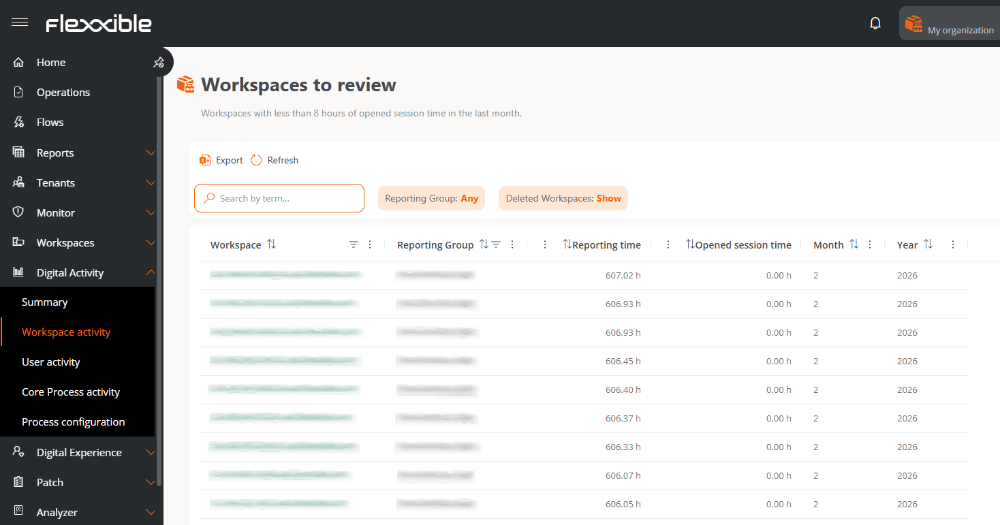
Indicates the number of devices with less than 8 hours of activity during the last month.- Includes variation compared to the previous period.
- It is clickable and redirects to the list of affected devices.
Users to review
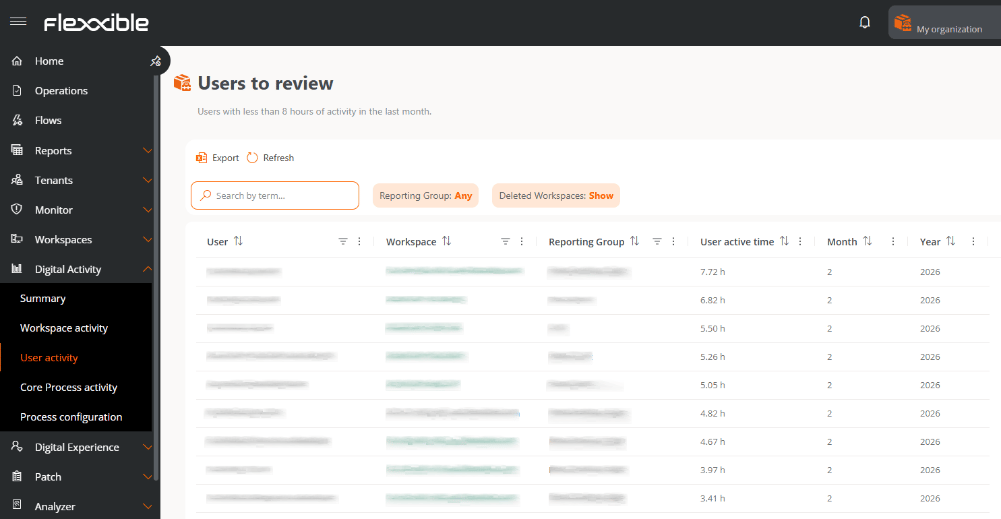
Shows users with less than 8 hours of activity in the last month.- Includes comparison with the previous period.
- Lets you access user details.
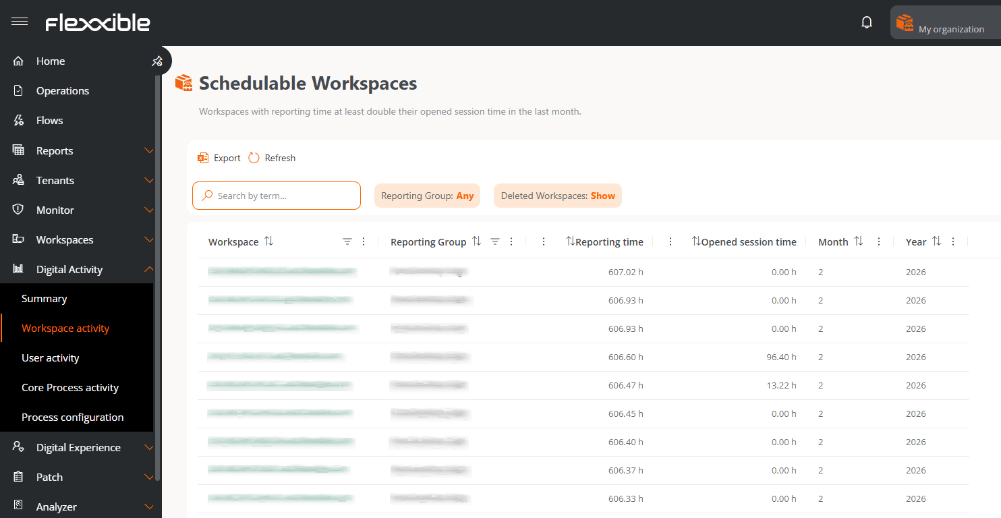
Schedulable workspaces
Identifies devices that remain powered on significantly longer than they are used.- Lets you detect automation opportunities (power on/off).
- Redirects to the list of devices.
General information
Shows average metrics for report and usage times at the device, user, and system process level during the month prior to the current one.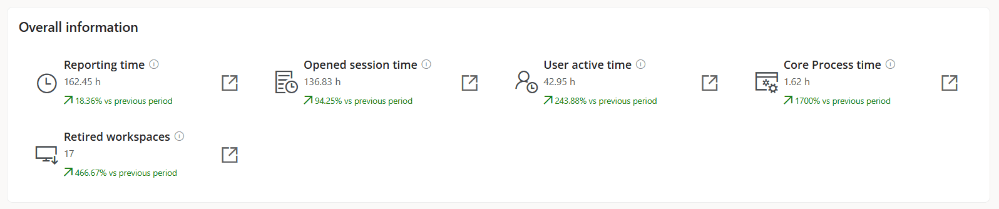
Report time
Average time devices have been powered on and reporting (per month).- Includes variation compared to the previous period.
- It is clickable and redirects to the Workspace activity view.
Open session time
Average time devices have had at least one user session open, regardless of whether there was activity (per month).- Includes variation compared to the previous period.
- It is clickable and redirects to the Workspace activity view.
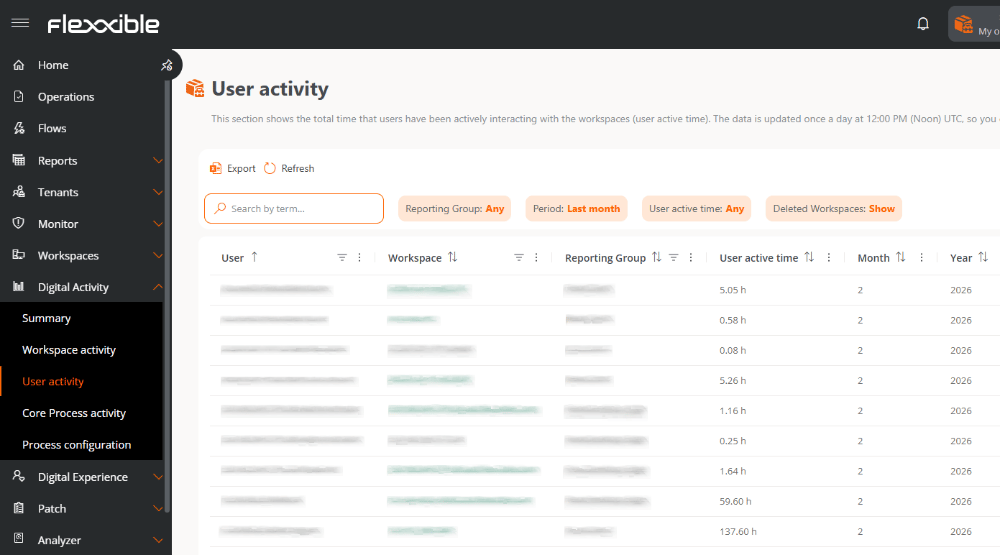
User activity time
Average time users have actively interacted with devices.- Includes variation compared to the previous period.
- It is clickable and redirects to the User activity view.
Process group activity time
Average time users have had focus on processes defined as key to the business (Core Process).A process is considered to have focus when its window is active in the foreground and the user is interacting with it.
- Includes variation compared to the previous period.
- It is clickable and redirects to the Process activity view.
Retired workspaces
Number of devices deleted during the month prior to the current one, along with the variation compared to the previous period.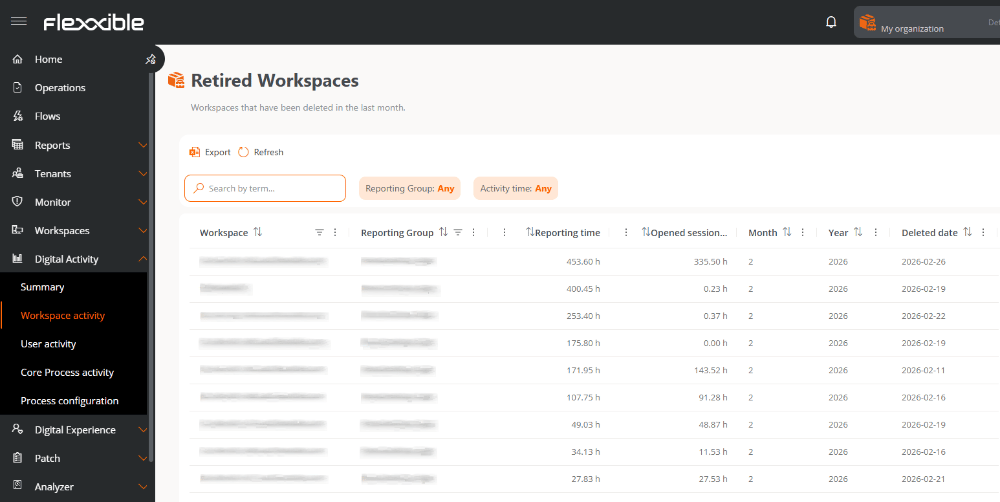
Configuration summary
Shows dashboards with information about the configuration of processes that are useful for the organization’s business.
Process groups
Number of Process groups configured for the organization. It is clickable and redirects to the Process configuration view.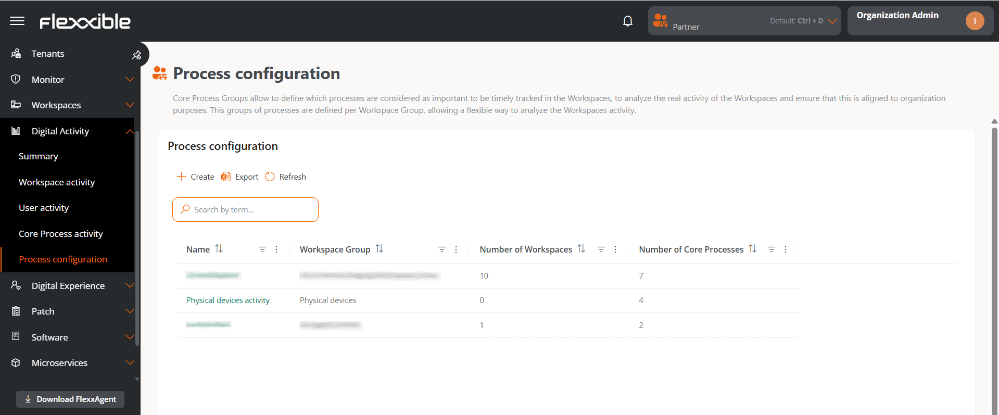
Unique processes
Total number of unique processes defined across all process groups. It is clickable and redirects to the Process configuration view.Dashboards
Unique monitored workspaces
Shows the evolution of the number of monitored devices.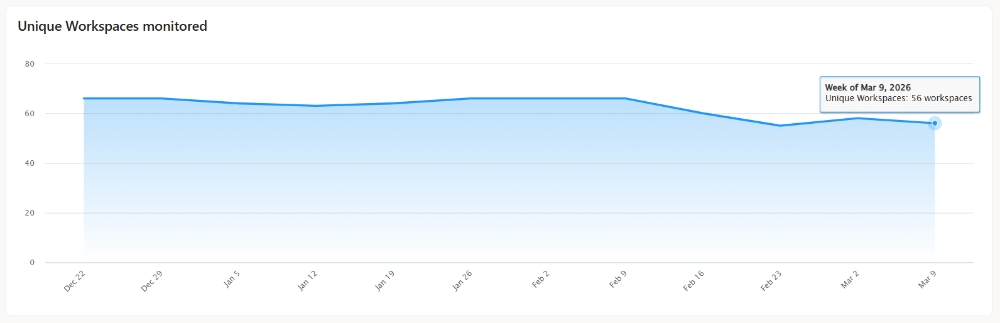
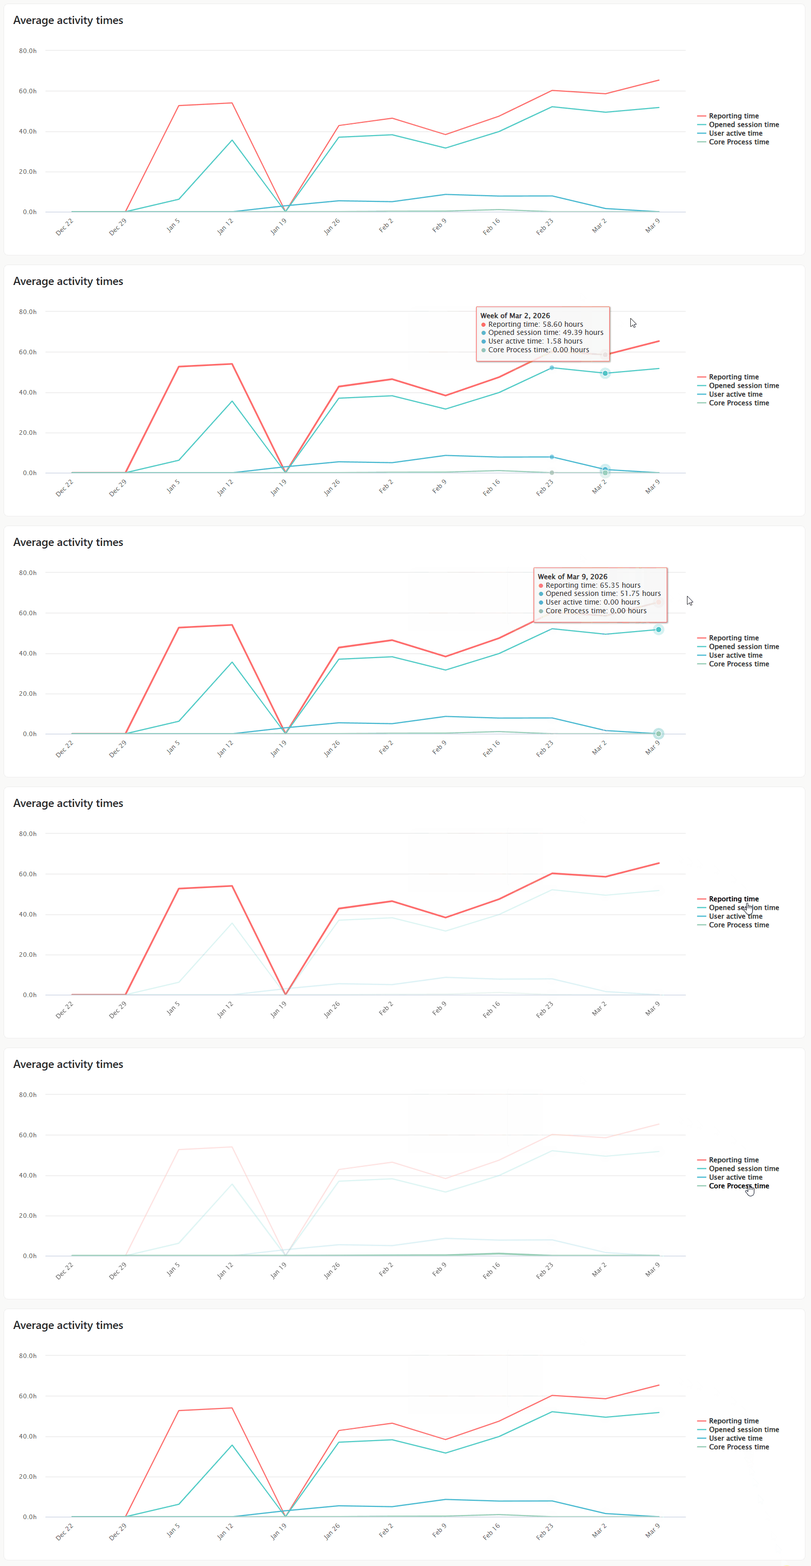
Average activity times
Shows the evolution of average activity based on:- Report generation time (device powered on)
- Open session time
- User activity time
- Process group time
Average report time by Report groups
Shows the evolution of the average time that devices in specific report groups have been powered on.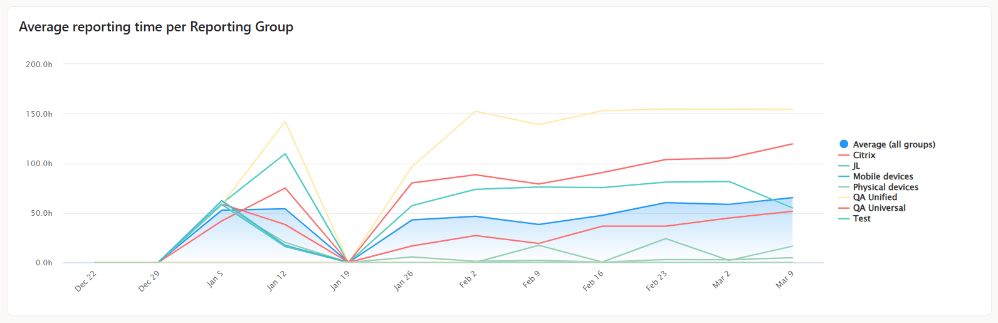
Average open session time by Report groups
Shows the evolution of the time during which at least one session has been open on devices. It does not consider the user’s level of interaction.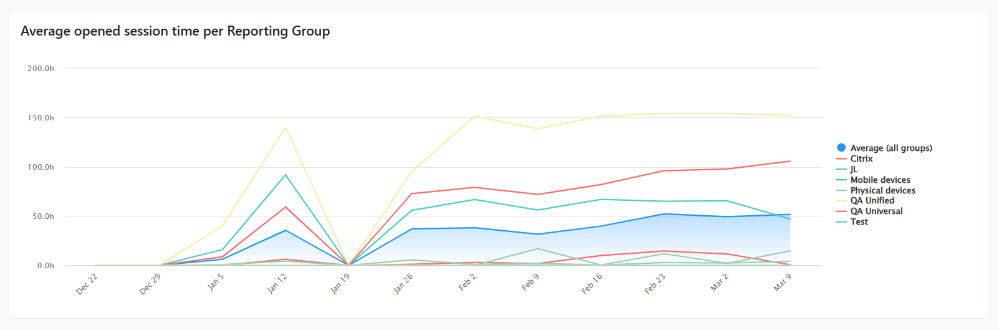
Average user activity time by Report groups
Shows the evolution of the average time that users belonging to a Report group have actively interacted with devices within each of the Report groups.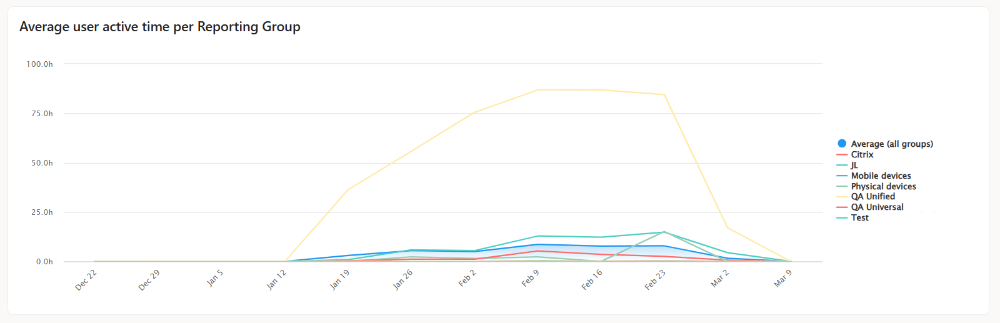
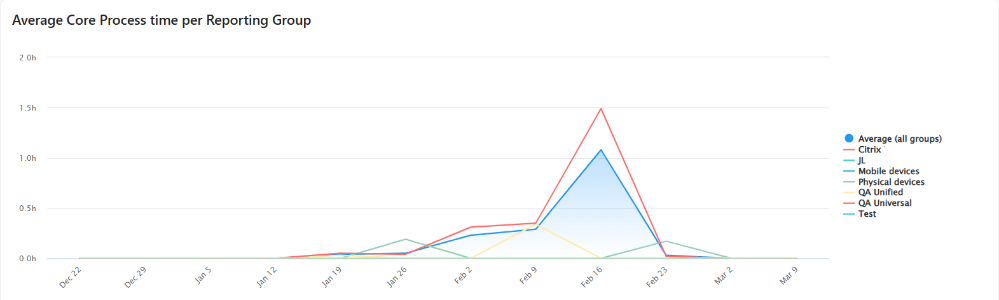
Average Process group time by Report group
Shows the evolution of the time that users belonging to a Report group have had focus on processes defined as Process groups.